

If you are like me, you absolutely hated those mandatory speed runs they made you do in PE. All they cared about was speed and things like slow gracious running, my specialty, were not valued at all. Well, it’s sad and funny at the same time, but the crystal clear truth is that speed matters everywhere. It matters to Usain Bolt, it matters to firefighters, and it matters to websites. So — Google’s PageSpeed Insights November update.
Ready? Set. Go!
A Rundown of the Most Important New Features
A short insight into the insights if you will.
I took Facebook as an example while using Google Insights. Why? I’ll get to that in a bit.
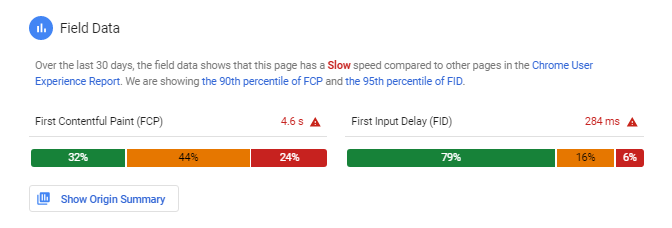
Field Data
It shows you the average loading speed of the web page you placed in the search box for the last 30 days. The data you see is based on the findings in the Chrome User Experience Report (CrUX). Here, you can see the number of pages that have had various loading speeds, thus giving you an overview of how your page loads for different internet speeds.
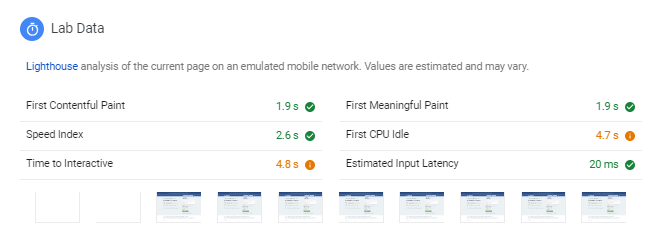
Lab Data
Since the November Google PageSpeed Insights update is largely based on incorporating Google’s now famous Lighthouse analysis engine and CrUX, you now get actual UX data plus all the Lighthouse audits. This section focuses on the time it takes for a page to reach a certain stage of responsiveness. There are six stages:
- First Contentful Paint — the time in which the text or image appears on the page
- First Meaningful Paint — when the primary page content is visible
- Speed Index — the amount of time it takes for content to populate the page
- Time to Interactive — how long it takes for your page to have clickable buttons
- First CPU Idle — same as 4 but for inputs
- Estimated Input Latency — the amount of time necessary for the page to be able to respond to user input
It sounds a bit too wordy, but if you play around with the tool a bit, you will easily remember what each stands for.
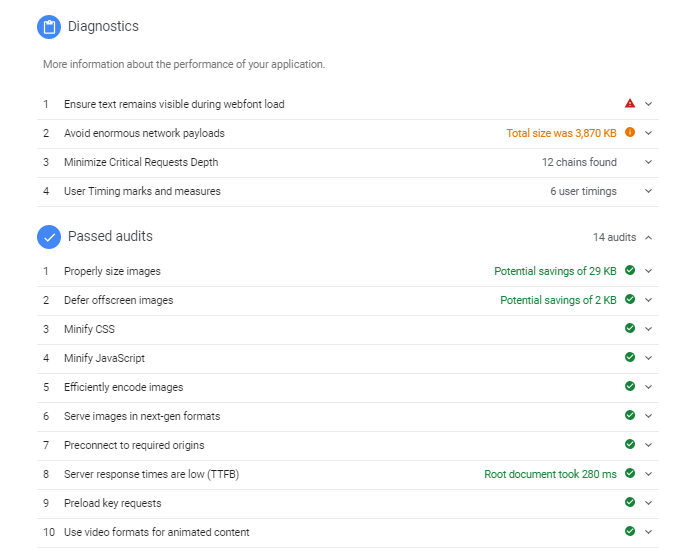
Diagnostics
This section represents a set of assessments that evaluate your page performance. In a nutshell, it gives you a report on how your page is doing in terms of caching, payloads, DOM size, JavaScript, and much more.
… and My Favorite — Opportunities
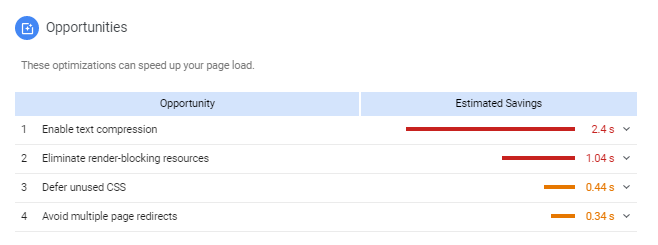
The opportunities section is your silver lining in a situation where your site speed needs a lot of improvement. It gives you valuable suggestions and the best part is, it shows you the estimated saving time you can benefit from if you follow these suggestions. I mean, how cool is that, really?
Should You Care
Yes and Yes.
Optimizing the speed of your site matters beyond rankings. Sure, rankings get you more virtual eyeballs so to speak, but if people have to wait for ages, which they won’t, to get to a particular page, you have virtually lost them as clients. So, you should care as it will improve user experience and boost conversion rates. Isn’t that something you want?
Walk That Extra Mile
If you take anything from this blog, may this paragraph be it.
At the end of the day, that cliche of going above and beyond is what will allow you to stand out in an overly crowded space where everyone can reach 100 and will probably stop improving once they do. By making time to optimize your images, clear the redundancies in your code, and deliver the best user experience you can, you will be pushing the bar when everyone else is just scraping by to get the bare minimum.
Why I Chose Facebook
There is a reason, you know…
Full disclosure, I simply had my Facebook opened at the time, and I was curious as to how it was doing in terms of speed. When you open Google Insights and enter a web page, it first shows you how its mobile version is performing. I was frankly shocked at first.
Facebook had the dramatic score of 42 on its mobile version.
Then I switched to see its desktop results, and it showed 91, all circled in a reassuring fresh green color. And I wondered, why is that? Aren’t most people using Facebook on their phones? It took a while, but it finally hit me. Facebook doesn’t need to develop its mobile version simply because it has a well-optimized application and every mobile user has it. It is a smart optimization of effort on their part and one worth mentioning.
To put things in a numerical perspective, according to Business of Apps, there are roughly around 2 billion smartphones currently in use worldwide, and out of that stunning number, around 85% of smartphone owners use the Facebook app. That is around 1 700 000 000 people. I’ll let that sink in for a sec.
However,
We are not all Facebook, and especially if you are a blogger, apps don’t really work for you. You need to optimize your mobile page performance. The famous Google Speed Update in July saw a lot of mobile rankings sink to the bottom which was proof enough you can’t skimp on improving page speed.
If I Had to Summarize the Key Takeaway
Not that it’s not obvious.
For a long time, Google Insights has been among the more credible page speed assessment tools around, and its latest update brings more depth to it, allowing you to go pass loading speed alone and move on to more realistic data on page performance and how to improve it further. With the much debated Google Speed Update from July this year affecting mobile page rankings, you stand to benefit a lot from this insightful tool update so you can create pages that perform better and ones that search engines can fall in love with faster.
What is next for page speed? We are yet to see. Until then though, don’t forget to focus on all important SEO components and not speed alone. Till next time!
Follow(function(d, s, id) {var js, fjs = d.getElementsByTagName(s)[0];if (d.getElementById(id)) return;js = d.createElement(s);js.id = id;js.src = “https://www.bloglovin.com/widget/js/loader.js?v=1”;fjs.parentNode.insertBefore(js, fjs);}(document, “script”, “bloglovin-sdk”))